Tuesday, January 17, 2017

SQL Server - SQL Partitioning

Before covering what to remember, let’s cover the basics. What is table partitioning in SQL Server? In SQL Server a partitioned table is one that is referred to as one table but is subdivided into multiple partitions in which data is partitioned horizontally. A partitioned table has the following properties:
  • Partition Scheme: This defines which file group the partitions’ data will be stored.
  • Partition Functions: This defines how the data is partitioned (think of it as a WHERE clause, which segregates data into separate partitions.) This ensures that a group of rows are mapped together into partitions.
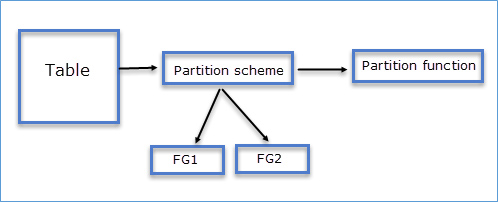
SQL Partition Scheme
The following is an example of testTable which is partitioned based on tranMonth:

CREATE PARTITION FUNCTION monthRangeFunction (int)

AS RANGE LEFT FOR VALUES (2, 4, 6, 8, 10, 12)

go

CREATE PARTITION SCHEME monthRangeScheme

AS PARTITION monthRangeFunction

TO (FG1, FG2, FG3, FG4, FG5, FG6, FG7)

go
When executing the above query, the data is partitioned based on the values specified for month. Here is an example of how the data is partitioned:
More details about the CREATE PARTITION SCHEME and CREATE PARTITION FUNCTION can be found on Microsoft’s Developer Network site here and here.
SQL Query Table

Benefits Of Partitioning

  • Speed: Data transfer is relatively fast in a partition compared to a table which is not partitioned.
  • Query performance: If you have queries which deal with a specific set of data, (e.g. current month) then partitioning the table will improve the performance of these types of queries.
  • Easy maintenance: Data in a partition can be easily SWITCHed , SPLIT, MERGEd as explained in these two articles.
  • Transferring Data Efficiently by Using Partition Switching
  • Alter Partition Function (Transact-SQL)
Also, you can chose to rebuild a partition of an index instead of rebuilding the entire partition.

Things To Remember

So far we’ve shown that partitioning is a great feature; but it does not fix all performance problems. Here are the few things to keep in mind while working with SQL Server partitioning:
As explained above, SWITCHING partitions is an easy approach to transfer data efficiently. But keep in mind:
  • The destination table. The partition must be created before SWTICHING the partition and it should be empty.
  • The destination and source partitions should reside on the same FILEGROUP.
  • If the partition has an identity column there is a possibility that the destination partition may have duplicate values or gaps in the identity column.
  • Both the source and destination partitions should have the same clustered and non-clustered indexes.
  • During the partition switch, a Schema Modification lock held on the table can cause a block for the users accessing the table.
  • An index is said to be aligned if the index and the table on which it is created both use the same partitioning function and columns in the same order. If there a large number of partitions defined, it is recommended to have more memory on the server. Otherwise there is a likelihood that the partitioned index may fail especially in the case of non-aligned indexes.
This is because when building the partition, SQL Server will create a sort table for each partition in the corresponding filegroup or in tempdb if the sort_in_tempdb option is specified. This requires a certain amount of memory. If the index is aligned, then the sort tables are created one at a time, thereby using small chunks of memory one at a time. However if the index is non-aligned, then the sort tables are created all at once. This drastically increases the amount of memory required for this operation.
  • If you are upgrading a database with partitions to SQL Server 2012 or above, you may notice a change in the histogram for the indexes. This is because starting SQL Server 2012, statistics are created by using the default sampling instead of scanning all the rows.
  • Use the TOP/MAX/MIN operators with care because for any queries using these operators, all the partitions must be evaluated. If the table is huge then such queries will perform slowly as it has to evaluate all the partitions before getting the desired result.
Over all, you need to evaluate partitioning based on the data in the table. Using partitioning just because it is a cool feature can have adverse effects in an OLTP environment. Partitioning is a right choice where you have a huge table to deal with as seen in Data warehousing environments.
You can read Pinal Dave’s other blogs here that cover more SQL topics. For a broader scope of database solutions, check out Datavail’s frequently updated Resources section.

Monday, January 16, 2017

SQL Server- How to find out the nth Highest salary


GO
use tempDB
-- How to Create New Table
CREATE TABLE Employee
(
       EMPID INT
      ,EMPNAME VARCHAR(50)
      ,SAL MONEY
      ,DOJ DATE
      ,LOC VARCHAR(50)
      ,GENDER CHAR(6)
      ,MagrID INT
      ,DEPTNO INT
)
INSERT INTO Employee(EMPID, EMPNAME, SAL, DOJ, LOC, GENDER, MagrID, DEPTNO)
VALUES(1,'Santhosh',35000,'01-12-2014','Bangalore','M',3,101)

INSERT INTO Employee
VALUES(2,'Kumari',30000,'11-05-2013','Chennai','F',3,104)

INSERT INTO Employee(EMPID, EMPNAME, SAL, DOJ, LOC, GENDER, MagrID, DEPTNO)
VALUES(3,'Kamesh',75000,'01-12-2012','Mumbai','M',NULL,105)

INSERT INTO Employee(EMPID, EMPNAME, SAL, LOC, GENDER, MagrID, DEPTNO)
VALUES(4,'Arun',44000,'Hyderabad','m',5,103)
INSERT INTO Employee(EMPID, EMPNAME, SAL, LOC, GENDER, MagrID, DEPTNO)
VALUES(6,'Reddy',44000,'Hyderabad','m',5,103)


INSERT INTO Employee(EMPID, EMPNAME,SAL, DOJ, LOC, GENDER, MagrID, DEPTNO)
VALUES(5,'Aishwarya',60000,'01-12-2014','Bangalore','f',3,103)


SELECT * FROM Employee
go
select * from (
select *,dense_rank() over( order by sal desc) rn   from Employee) rn
where rn=3
go
Select  *
From    Employee E1
Where 3 = (Select Count(Distinct(E2.SAL)) From Employee E2 Where E2.SAL >= E1.SAL)

SQL SERVER - Conversion Functions

1. CAST:-

-- CAST
-- CAST Function is used to convert the data from one data type to another data type
-- Example -1
SELECT CAST('46543.8798' AS FLOAT) AS [Float_Val],
       CAST('46543.8798' AS DECIMAL) AS [Decimal_Val],
       CAST('46543.8798' AS DECIMAL(7,2)) AS [Decimal_Value_with_length],
       CAST('01/13/2012' AS DATETIME) as [Date_Val]
 -- Example -2
DECLARE @A INT
DECLARE @B VARCHAR(100)
SET @A=240
SET @B='The Given Number is: '
--SELECT @B+@A AS TOTAL

SELECT @B+CAST(@A AS VARCHAR) AS TOTAL

2. CONVERT:-

-- CONVERT
-- CONVERT Function is used to convert the data from one data type to another data type
-- Example -1
SELECT CONVERT(FLOAT, '46543.8798') AS [Float_Val],
       CONVERT(DECIMAL, '46543.8798') AS [Decimal_Val],
       CONVERT(DECIMAL(7,2), '46543.8798') AS [Decimal_Value_with_length],
       CONVERT(DATETIME,'01/13/2012') AS [Date_Val]

SQL Server - Interview Questions & Answers

Scenario 1:

SELECT 1 + NULL
          Ans :-  NULL                 :-
          Question-2: SELECT 1- NULL
          Ans :-  NULL    
          Question-3: SELECT 1* NULL
          Ans :-   NULL    

          Question-4: SELECT 1/ NULL
          Ans :-   NULL

Scenario 2:

Question-1:   SELECT CASE WHEN 1=1
                                   THEN 'True' else 'False' End
          Ans :-    True  
                 Question-2: SELECT CASE WHEN NULL=NULL
                                    THEN 'True' else 'False' End
          Ans :-   False   

Thursday, January 5, 2017

SSRS - SSRS report execution and performance enhancements

SSRS 2008 R2 allows us to execute reports in 3 modes:

1. On Demand.
2. From Cache
3. From Snapshots

On demand:
 This is normal approach that we follow, by hitting a report server URL. Each time a report is run, data is returned from the database server and rendered to the report.
This approach ensures that our report is update and fresh.
The downside of this approach is that, if n users open up this report on their browsers, queries on the report are executed n times.
Thus this approach at times might slow down the server.

Cache
One of the performance enhancements techniques is to cache a report when it is initially run.
This means that if another user requests for the report, the same report is served to the user from the cache
This avoids people querying the database server from each report rendering.
To make sure that people do not receive too much stale data, we can set a time to invalidate a cache.
This is a good performance enhancement technique for slow running reports.

Snapshots:
 Report snapshots are created at a particular schedule for certain parameters.
Please note that parameters cannot be changes on snapshot reports.
SSRS 2008 R2 allows to schedule the snapshot creation times.
Users can directly render a report from a snapshot. However please note that not all reports can have snapshots, especially the ones that prompt users for credentials.

SSRS - SSRS Document Maps

A document map in an SSRS report, provides pointers/links to certain report items in your report.
If you have a document map in your report, it will appear in the left most pane. Clicking on any of the links, in the document pane, jumps the users directly to the report item.
It is similar to the table of contents.
Please note that clicking on the document map links, refreshes the report.

Lets look at an example for a document map.

Step 1: Create a blank report by connecting to Adventure works database.
I have used the following query to create my dataset:


SELECT  Sales.SalesTerritory.Name as Region,
        Sales.SalesTerritory.CountryRegionCode,
        Sales.SalesTerritory.[Group] as Territory,
        Year(Sales.SalesOrderHeader.DueDate) as Year,
        Month(Sales.SalesOrderHeader.DueDate) as Month,
        Sales.SalesOrderHeader.TotalDue
FROM Sales.SalesTerritory
INNER JOIN Sales.SalesOrderHeader
ON Sales.SalesTerritory.TerritoryID = Sales.SalesOrderHeader.TerritoryID
Order by  Sales.SalesTerritory.CountryRegionCode


Your design view after creating the report should look something like this.


Please observe the Row groups.
Adding Territory as a group is necessary here, else SSRS will repeat the Territory values in the document map.
You can hide one of the territory column (the non-group one) in the report.

Next, goto the Territory column, and select the properties.
Go ahead and choose Territory in the DocumentMaps Property:


Now hit preview, and you should be ale to see the follow SSRS 2008 R2 report with a document map:


Select any one Territory in the document map, and the report will jump to the appropriate page.

SSRS - SSRS Charts and Graphs

SSRS charts and graphs helps to summarize the data in visual format. It enables to represent very large datasets as aggregated information available at a glance.
SSRS 2008 R2 also added sparklines to the visualization tools.
In addition, SSRS 2008 R2 also supports guages/Databasrs/Sparkline/Indicators.

One of the most exciting features of SSRS being, usage of Maps.
It allows an awesome representation of Geagraphic data using maps.

Lets look at some basic graphs and shapes.

Step 1:
As usual, lets create a blank report, connecting to adventure works database with dataset:


SELECT  Sales.SalesTerritory.Name as Region,
        Sales.SalesTerritory.CountryRegionCode,
        Sales.SalesTerritory.[Group] as Territory,
        Year(Sales.SalesOrderHeader.DueDate) as Year,
        Month(Sales.SalesOrderHeader.DueDate) as Month,
        Sales.SalesOrderHeader.TotalDue
FROM Sales.SalesTerritory
INNER JOIN Sales.SalesOrderHeader
ON Sales.SalesTerritory.TerritoryID = Sales.SalesOrderHeader.TerritoryID


Step 2:
Now lets drag and drop a chart control from the toolbox.
As soon as you do that , you get a pop-up, displaying various image shapes for the chart control.


Step 3: These are the set of shapes provided by SSRS for visualization purposes.
Let's choose the first shape.
You should be getting something like this on your scree:


Step 4: This is a blank chart,with no data in it.
You can click on the headings/text in the axis and change accordingly.
Alternatively , you can also write SSRS expressions to change text/descriptions dynamically.
Please refer my previous tutorial, on SSRS expressions.


Step 5: In the above example, i have changed the chart title to 'My First Chart'
Now drag and drop TotalDue to the summation of values, CountryRegionCode to the CategoryGroups and year to the series Groups.
Something like this...


Step 6: Hit Preview, and you be getting something like this:

Step 7: Try these steps, with a number of other shapes and graphs/Sparklines/Indicators.

SSRS - SSRS Subreports

SSRS Subreports are extremely helpful, when we need to embed multiple reports in a single report.
The main report serves as a container for multiple sub-reports.
SSRS gives us complete control over what parameters to be passed to the sub report.
Many times this is useful in matrix reports too.

Lets look at an example of a sub-report.

We are going to create a main report with 1 parameter.
As soon as someone selects a parameter, relevant data is displayed + the sub report is also filtered and displayed in the main report itself.

Step 1: Create a main report (Steps to create a basic report can be found in the previous tutorials)
I have the following dataset:

SELECT [TerritoryID]
      ,[Name]
      ,[CountryRegionCode]
      ,[Group]
      ,[SalesYTD]
      ,[SalesLastYear]
      ,[CostYTD]
      ,[CostLastYear]
      ,[rowguid]
      ,[ModifiedDate]
  FROM [AdventureWorks].[Sales].[SalesTerritory]

  Where CountryRegionCode = @CRC


Step 2:  Create a parameter called CRC.

Step 3: Your Main report would look something like this.


Step 4: Now lets add a sub-report and pass in the same parameter to it.
Drag and drop a sub-report control from the toolbox.


Step 5: Now click on the sub-report properties.

Step 6: Lets us the previous tablix report that we created as our sub-report.

Step 7:
Choose the parameters tab, and configure the parameters

Step 8: click OK and hit preview.
You should be able to see the main and the sub-report.

SSRS - Drilldown Matrix Reports

Matrix reports are very useful, and it allows total flexibility too.
For instance we could easily convert a matrix report to tabular.

In this tutorial, lets see how to add the drill down feature to an existing matrix report.
Lets take the same matrix report, which we created in the last tutorial.

This is how it looked:


Lets add some child groupings to this report, and explore some visibility toggling features.

Step 1: Right click on the Territory field and add a child group:


Step 2: Choose 'CountryRegionCode' to group by:


Step 3: Your design view would look something like this:


Step 4: Hit preview.


Congratulations - your matrix report is ready.

Lets proceed to see some visibility toggling features

Step 5: Click on the row groups - 'CountryRegionRegion' and select the group properties:


Step 6:  In the visibility pane, check 'Hide' for  'When the report is initially run'
Also, check the 'display can be toggled by this report item' for Territory


Step 7: Select OK and hit preview.
You should be able to toggle the report.


Search This Blog

DAX - Grouping on multiple columns and the count

Please go thorugh the below URL for entire soultion. http://community.powerbi.com/t5/Desktop/DAX-Grouping-on-multiple-columns-and-the-cou...